

This blog is the third in a series of articles introducing different sources of public data and how you can use it to improve your research, evidence need and develop insights. In this blog, we showcase how public data can be used to garner insights by revisiting our previous blog series on the topic of homelessness in England.
In 2023, we released three blogs on the theme of homelessness in England. Our analysis uncovered some stark differences in how the number of families seeking support due to them being at risk of being made homeless or having been made homeless has changed across different parts of England. Unfortunately, the national picture has not improved. In late 2024, Shelter published research showing that at least 354,000 people in England would be spending Christmas without a home, a rise of 14% since 2022. We have revisited the topic and reviewed the quarterly national data that has been published since our blog series ended. The data now extends to June 2024.
As a reminder, if a family is assessed as being at risk of being made homeless, the local authority has a duty to help prevent this from happening. This is known as the Prevention Duty. If they have lost their home, they are eligible for a relief duty.
Relief duties on the rise
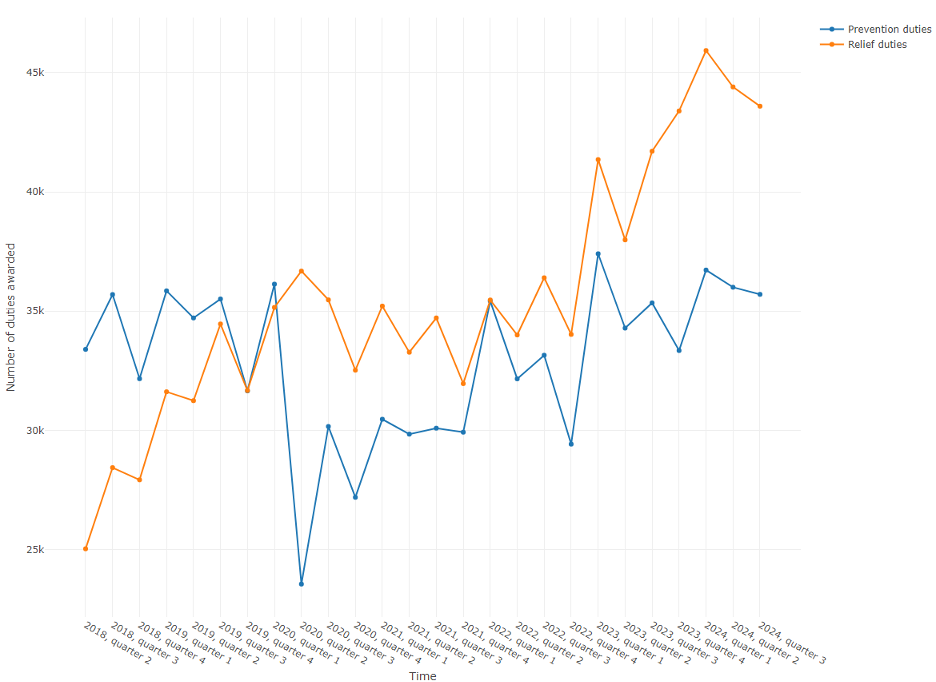
Due to efforts to keep people safe during the COVID-19 pandemic, the number of families eligible for a prevention duty fell sharply in early 2020. By mid-2024, the number of prevention duties awarded had almost returned to pre-pandemic levels. More concerningly, the number of relief duties awarded has steadily risen, to the point that the number of duties awarded passed the peak seen at the beginning of 2020 at the start of 2023 and continuing to rise into 2024. The plot below shows how the picture has changed over time.
On a more local level, every region of England has seen the number of relief duties awarded exceed previous seen during the covid-19 pandemic. London continues to have the largest number of families at risk of, or experiencing homelessness. A major driver of this is rent inflation. ONS statistics on rental inflation published in April 2025 showed that rental costs in England had increased by 7.8%, with private rental inflation being high in the capital (9.1%). Coupled with the average rental in London now costing £2243, it is understandable that the number of individuals at risk of losing their home is high.
Rough sleeping increasing
Staying with friends or family is unfortunately not an option for everyone who finds themselves at risk of homelessness, and the number of people sleeping rough continues to rise. In our previous blogs, we used figures on the number of families who are sleeping rough provided in the quarterly reporting. This time, we have instead looked at the Rough Sleeping Data Framework as this reports the number of individuals found to be sleeping rough on a month-by-month basis rather than talking about families which may refer to multiple people. We plotted data from the most recent publication at the time of writing this blog, which covers from October 2020 to December 2024, specifically focusing on the data on unique rough sleepers encountered per month.
Across all regions, the number of rough sleepers has risen over time. There is a general pattern of the number of rough sleepers falling slightly in autumn months, likely because of interventions that are designed to ensure the safety of rough sleepers in colder months. Unfortunately, the numbers consistently rise again in spring months. In recent years, the rise in rough sleepers has been so substantial that the fall back has still not reduced the number of rough sleepers reported to a level below the peak seen in the previous year. Click here to view a plot that shows the number of rough sleepers in each region of the UK as recorded in the Rough Sleeping Data Framework. This plot is interactive. You can remove a region from the plot by clicking it in the legend. Double clicking will retain only that region. You can also use the slider below the plot to adjust the date range shown.
Impact on services
The rise in rough sleeping will inevitably lead to an increase in pressure on pubic services and charities operating in this space. Cold weather sees local authorities activate their Severe Weather Emergency Protocol (SWEP). SWEP sees additional emergency accommodation opened up to rough sleepers to keep them safe from the cold weather. Many Local authorities have activated SWEP in early 2025 due to the temperature falling below freezing. With the number of individuals reported to be sleeping rough rising, the pressure on local authorities and charities supporting vulnerable individuals will continue to rise. According to the Charity Commission, there are over 7,800 charities in England and Wales that provide support with accommodation in one form or another.
How charities can use these findings
Public data offers powerful insights that can be leveraged by charities in a variety of ways. It is common to see charities use data of this type to highlight the demands they are facing in public appeals for support. It can also be used to evidence need when approaching potential funders. In some cases, it may also provide evidence of programme impact by setting your localised figures against a broader trend.
More broadly, it can be used as a means of improving understanding of the people you exist to support and adapting the support on offer. In the case of this homeless data, it contains numerous sub categories that break down who the individuals and families behind the numbers are. This allows the support they offer to be tailored to best meet their needs. It may also lead to the identification of opportunities for collaboration with other organisations operating in the same space.
Lastly, it can be used to help identify where best to deploy available resources. This may mean allocating more resources to an existing programme, or identifying the need for a different programme that is currently unmet by your existing offer.
If you are interested in making use of public data and want to discuss this with us, please get in touch today: hello@thecharityspark.co.uk
Data in this analysis was sourced from the government collections on homelessness statistics, specifically the quarterly statistics on homelessness and the Ending Rough Sleeping Data Framework. It contains public sector information licensed under the Open Government Licence v3.0.
