

Written by Daniel Pledger
Homelessness is a major issue in the UK. Due to a number of economic and socio-political to factors including the increasing cost of living and rising rents, it is likely that homelessness will be a persistent and growing problem for years to come. The latest statistics showed that over 83,000 households in England were assessed as homeless or threatened with homelessness (defined as at risk of being made homeless within 56 days) between January and March 2023. Shelter estimate that this equates to around 271,00 unique individuals; around one in 208 people living in the UK today. The causes of homelessness are varied, so the support individuals need when facing homelessness are equally diverse. The annual cost of homelessness to councils in England was estimated by Shelter to be over one billion pounds in 2019.
Local authorities have specific responsibilities if homelessness assistance is applied for by someone living within that LA. If a person is assessed as being at risk of being made homeless, the local authority has a duty to help prevent this from happening. This is known as the Prevention Duty. Data on prevention duty cases is released quarterly. Since 2018, this data has been published at a regional and local authority level. To explore how the number of cases has varied over time and by region, we have analysed this data. The figure below shows how the number of households who are eligible to receive a prevention duty by region has changed since 2018.
To view the interactive version of the plot, click here. You can look at one specific region by double clicking that region on the legend. A single click will hide it-as you change which regions are visible, the axes will rescale accordingly.
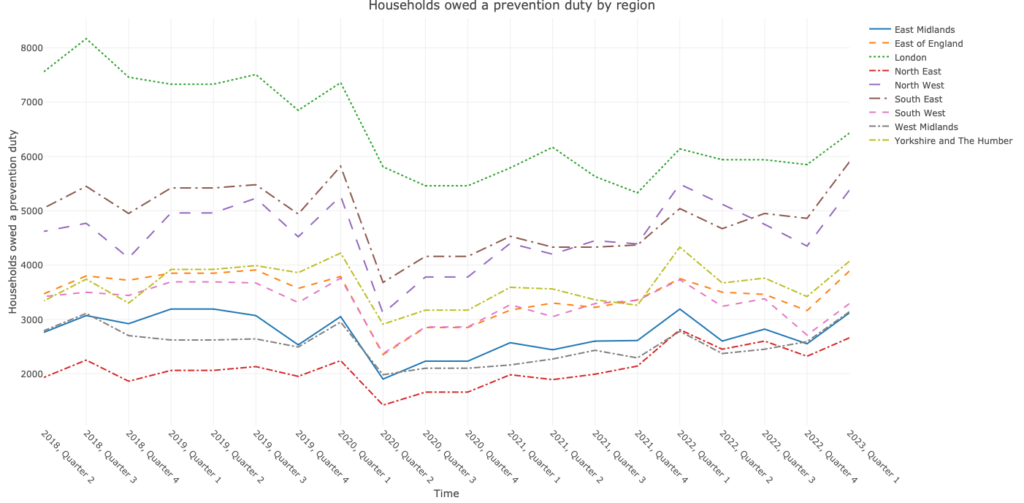
This shows that compared to the beginning of 2019, four regions have a lower number of families at risk of homelessness in 2023. The number in London in particular fell sharply-from 8,170 to 6,430. The other regions which have a lower number of prevention duties are the East of England, the East Midlands, and the South West.
Levels of homelessness relative to the local population
Despite seeing an increase in the number of at-risk families compared to 2019, the North East still has the lowest number of at-risk families. It must be pointed out that this is the total number of families and will naturally be higher in regions with a higher population, such as London. The official statistics also give a count of the number of households at risk of homelessness per 1000 households within that region. The picture changes significantly when calculated in this manner instead. Data illustrating this is available from the beginning of 2019 and is plotted below. For the interactive version, click here.
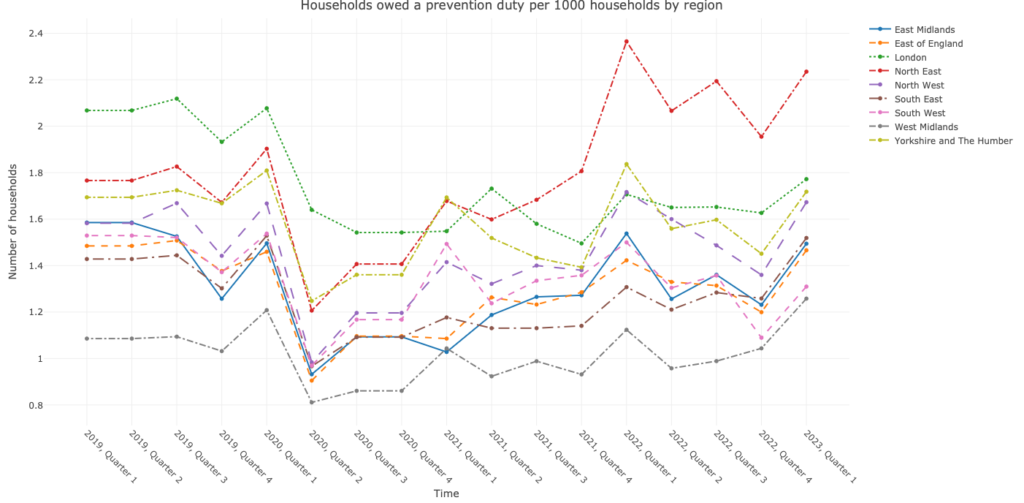
This shows that across most regions, the ratio of families at risk of homelessness is broadly unchanged since 2019. The two major exceptions are London which has fallen from 2.06 families per thousand at risk in 2019 to 1.77 in 2023, and the North East which has risen from 1.76 families per 1000 to 2.23. This shows that although the North East has less families at risk of homelessness overall, the number of households at risk compared to the population as a whole is higher. All other regions are relatively close in terms of the number of households at risk per 1000.
The North East is home to some of the most disadvantaged communities in the country. Much of this has been driven by changes in industry (decline in industries such as coal mining and shipbuilding) over the last 100 years. The fall of these industries in the NE has led to a reduction in the number of jobs, which impacts the affordability of good quality housing. Many of the jobs which filled that void are the sort of jobs which were at the highest risk of being lost. A report by McKinsey highlighted that there is a relationship between median pay by region and the % of jobs “at risk” during the pandemic. They defined at risk as “at high risk of furloughs, layoffs or reductions in hours/pay during periods of peak physical distancing”. More than half of these at risk jobs paid under £10 per hour in 2019.
As the economic COVID support ended, people struggled more in the North East than other regions as a result. Charities and non-profits work across North East and the UK, to support people facing homelessness and unemployment. The impact of national policy changes continues to be important.
The other notable trend in this data is the fall in the number of households at risk across all regions in 2020 which illustrates the nationwide impact of policies and support implemented as a result of the COVID-19 pandemic, including the rental eviction ban and increased support for homeowners through mortgage payment holidays. As this support was phased out, more families would naturally be at risk of homelessness, which corresponds to the general increasing trend seen across the nation.
How do things look in my region?
The data in this analysis is available at both a local authority and regional level. We have analysed data at a local authority level in the same manner. Links to plots for each region are included below. Please be aware that there may be gaps in the data presented. This is usually where a local authority has not provided the data for that quarter, or due to changes in LA boundaries.
How we are helping
We have completed independent evaluations and provided impact measurement support to several charities working with those who are homeless and vulnerably housed. They see first-hand the real stories behind these figures and the challenges that surround the need for safe, secure housing.
By using national and local data to contextualise anecdotal evidence, we can help the organisations we work with to demonstrate the need in their area when compared to other localities as well as corroborate their own findings against the trends in other areas. Data in this analysis was sourced from the government collections on homelessness statistics which contains public sector information licensed under the Open Government Licence v3.0.
